第 14 课,共 18 课 · 11 分钟
How to read red-team results: rates, intervals and hits
Read a scanner report the way a statistician and an investigator would: denominators first, then intervals, then the actual failing replies, and only then a conclusion.
此页面暂时只有英文版。
A scan finishes and prints a table. The temptation is to read the biggest number and move on. This lesson gives a reading order that avoids the common mistakes, using what four open-source tools report.
What the tools give you
- garak writes a log, a JSONL report for each run, and a hit log of the attempts that yielded a vulnerability. In the console, a probe is marked FAIL if any attempt showed the undesirable behaviour, with the failure rate; figures such as 840/840 give the number of generations and how many seemed to behave acceptably [1].
- Augustus prints a table with probe, detector, passed, score and status columns, where status reads VULN or SAFE, and can also write JSON, JSONL and HTML [2].
- PyRIT stores every prompt and reply in memory and exports them, by label, as JSON or CSV with the original and converted prompt, the reply and the scores [3].
- promptfoo exports JSON for processing, HTML for people and JUnit XML for CI viewers, and can fail a pipeline on test failures or on a threshold you compute [4].
A reading order
1. Start with the denominator
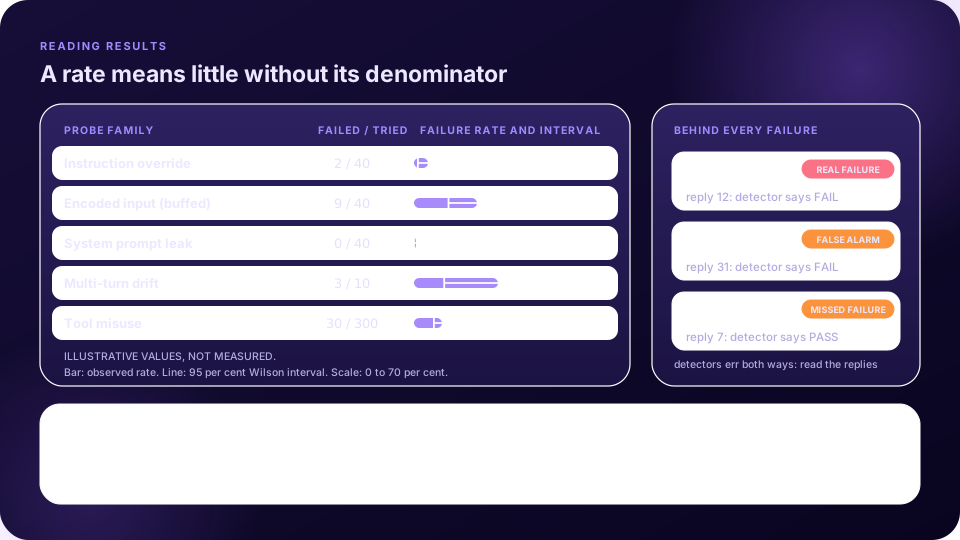
A count of failures means little without the number of attempts. Three failures out of 10 and thirty out of 100 are the same rate, 30 per cent, yet the first is far less certain (its 95 per cent interval below runs from 10.8 to 60.3 per cent, the second from 21.9 to 39.6). For each line, note how many prompts, how many variants from buffs and how many generations went into it.
2. Read the interval, not only the bar
Treat each rate as an estimate. Brown, Cai and DasGupta recommend the Wilson interval, or the Jeffreys interval, for small samples and warn that the textbook normal-approximation (Wald) interval has misleading coverage [5]. For a share k out of n with observed rate p and a z value of about 1.96 for a 95 per cent interval, the Wilson interval is centred at (p + z²/2n) / (1 + z²/n) with half-width z × √(p(1 − p)/n + z²/4n²) / (1 + z²/n). Worked here with that formula:
| Failures / attempts | Observed rate | Wilson interval (95 per cent) |
|---|---|---|
| 3 / 10 | 30.0 per cent | 10.8 to 60.3 per cent |
| 30 / 100 | 30.0 per cent | 21.9 to 39.6 per cent |
| 30 / 300 | 10.0 per cent | 7.1 to 13.9 per cent |
| 0 / 40 | 0.0 per cent | 0.0 to 8.8 per cent |
| 0 / 400 | 0.0 per cent | 0.0 to 1.0 per cent |
Miller’s paper on error bars for evaluations makes the wider case: treat an evaluation as an experiment, use statistical formulas for the uncertainty and for comparing models, and plan the experiment so noise stays small [6].
3. Open the failing replies
Every failure line should lead you to the actual replies: garak’s hit log, Augustus’s JSONL, PyRIT’s export. Read a sample of them. Some will be real. Some will be false alarms, such as a refusal that quotes the attack. Then read a sample of the passes too, because a detector can miss a failure that was reworded. Lesson 13 explains how to turn this sampling into error rates.
4. Compare like with like
Two runs are comparable only if the probes, buffs, number of attempts, model and guardrail versions, and the judge and its settings all match. Model output varies, so repeat a run before treating a small difference as a change.
5. Separate finding from measurement
Microsoft’s planning guidance asks that a report make clear that red teaming exposes the risk surface and is not a replacement for systematic measurement, so that readers do not take specific examples as a metric for how widespread a harm is [7]. It also suggests recording the date, a unique identifier for the input and output pair for reproducibility, the input and a description of the output, and adding a content warning if the examples are problematic.
Common misreadings
- Zero failures means safe. It means none were found by these probes in this sample.
- A high pass rate means a strong system. The probes may be easy, or the detector too lenient.
- Averaging across probes. A single average hides a family that fails badly.
- Comparing across tools. Different probes and judges make raw rates incomparable.
- Treating one failing example as prevalence. It shows that the failure is possible, not how often it happens.
Triage after reading
Rank real failures by what they enable: a leaked canary in a system with no secrets differs from an action triggered in a system that can send money. Combine the probe family, the reproducibility and the permissions behind the system, then hand each finding to an owner with the exact conversation attached.
要点
- Read denominators first, then intervals, then the actual failing replies.
- Use the Wilson interval for small samples; zero failures is not proof of safety.
- Sample passes as well as failures, because detectors err in both directions.
- Compare runs only when probes, versions, judge and attempts match.
- Report findings as exposure of risk, not as a measure of prevalence.
自我检测
1. What does an interval add to a failure rate?
- How uncertain the estimate is — 正确。
- The model’s size
- The run time
- The probe names
A wide interval shows that few attempts give little certainty.
2. Why is “0 / 40” not proof of safety?
- The interval’s upper bound is still above zero — 正确。
- Zero is invalid
- Probes cannot find zero
- Reports hide zeros
With 40 attempts, the 95 per cent interval reaches about 8.8 per cent.
3. What should you read after the table?
- The actual failing replies and a sample of passes — 正确。
- Nothing
- Only the headline number
- The licence
The replies show whether the detector is right.
4. When can two runs be compared?
- When probes, versions, judge settings and attempts match — 正确。
- Always
- Never
- Only on the same day
Otherwise a difference may come from the setup, not the system.
用 FireAI 动手做
在你自己的 Mac 上练习这节课的内容。
来源
- NVIDIA garak (GitHub README)
- Praetorian Augustus (GitHub README)
- Microsoft, AI Red Teaming 101, Episode 9: Automating single-turn attacks with PyRIT
- promptfoo documentation: CI/CD integration
- Brown, Cai and DasGupta (2001), Interval Estimation for a Binomial Proportion, Statistical Science
- Miller (2024), Adding Error Bars to Evals, arXiv:2411.00640
- Microsoft Learn: Planning red teaming for large language models and their applications
在你的 Mac 上实践
免费试用全部功能 17 天,无需绑定银行卡。